Guide · The Donut Agency
Advanced Guide To Growing Email & SMS Revenue
Turn your customer data into higher LTV and returning customer revenue.
If your email and SMS revenue has flatlined, it might be because you (or your agency/freelancer/in-house team) are following templated tactics used by smaller brands.
Here are some tell-tale signs. If you see these discussions too often in your Slack channel, it's time to step up the game:
1. Over-testing subject lines instead of email content. It is easy to test, and anyone can generate 50 subject line ideas with AI. But easy does not always make you more money.
2. Copying “creative” emails from “big brands” instead of measuring what works for you. You know how this meeting goes:
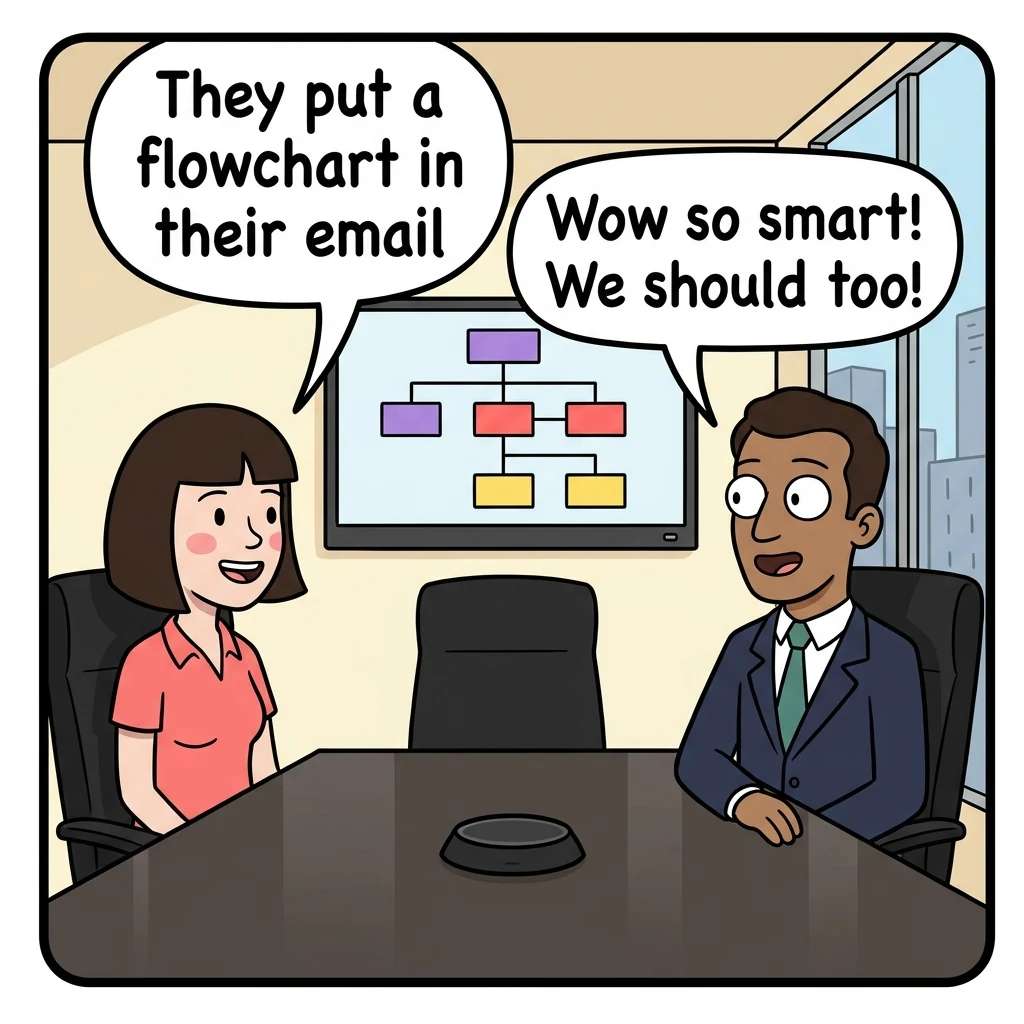

3. Tracking the wrong metrics. Small brands obsess over click-through rate and revenue per recipient. Spoiler alert: these metrics don't correlate with revenue. Advanced players are focused on other KPIs that actually drive revenue higher, and I'll show you exactly which ones next.
These tactics are cute, but they're also the reason why your email & SMS are not growing.
After running 1000+ tests with 30+ 8- and 9-figure DTC brands, I'm going to show you exactly how to take your email & SMS program from beginner to advanced mode and grow your LTV and returning customer revenue (and as a bonus, your new customer revenue too).
The Retention Dashboard of a 9-figure brand:
LTV by products
Which products bring the best customers?
Product journey analysis
What do they buy next?
Co-purchase analysis
What gets bought together?
Sales velocity
What sells now, and next season?
Purchase latency
When is the best time to cross-sell?
Churn prediction
Who needs winning back, and when?
The KPIs you should actually track
If you ask beginners what KPIs they track, expect to get this answer:
- Open rate
- Click-through rate
- Revenue per recipient
Here's the problem with these 3 ‘KPIs’... if you email your mom, your aunt, and your grandma, you get a 100% open rate, a 100% click rate, and 3 orders.
Sorry, I know it's an extreme example, but the point stands. The purpose of your email and SMS is to drive as many people as possible back to your website, where they can be converted into customers. If you only email “engaged audiences” to chase a sky-high open rate and click rate, you send fewer people back to your website than you could have.
9-figure brands treat these numbers as secondary KPIs. Good to keep an eye on, not major revenue drivers.
So what KPIs do 9-figure brands track?
Customer value
- LTV, broken down by products and by 30d / 90d / 365d
- Returning customer revenue
- New customer revenue
- Total revenue, broken down by new vs returning (not revenue per recipient)
- Total opens (not open rate)
- Total clicks (not click-through rate)
SMS
- Total revenue, broken down by new vs returning
- Total clicks
- Earnings per message, per segment
Now you know the right KPIs. But say your LTV is too low, your CAC has no breathing room, and your returning customer revenue is dropping. What do you do?
The KPIs tell you something is wrong, but they don't tell you how to turn it around. For that, we need deeper analysis. Here's how 9-figure brands analyze their data to keep those KPIs moving in the right direction.
Breaking down the 6 analyses in 9-figure Retention Dashboards
Each one powers a real tactic in your email & SMS. No analysis for the sake of analysis.
- 1.
LTV by products Which products bring in your best customers?
→ What to feature in welcome flows, winback flows, and sale campaigns.
- 2.
Product journey analysis What is each customer most likely to buy next?
→ Segments built on purchase history. Recommend the product each customer is most likely to convert on, in cross-sell flows and targeted campaigns.
- 3.
Cart analysis Which products get bought together?
→ Bundles, checkout add-ons, and post-purchase upsells that actually attach.
- 4.
Sales velocity What sells fastest right now, and as seasons change?
→ What to promote this month, seasonal calendar planning, low-stock and back-in-stock campaigns.
- 5.
Purchase latency When is the best time to cross-sell the next product?
→ When your cross-sell and replenishment flows fire. Before the average gap, not after it.
- 6.
Churn prediction When do you need to go all out to win a customer back?
→ When winback flows trigger, who enters winback campaigns, who gets the direct mail.
Every claim in this guide comes from client work. Some brands are anonymized. The numbers are real.
Let's get into each one, one by one.
Section 1
LTV
“Whoever can spend the most money to acquire a customer wins.”
The only sustainable way to spend the most is to make each customer worth the most. Raise 90-day LTV and your allowable CAC rises with it, because you can outbid competitors for the same customer in the same auction, and they cannot follow you without losing money on every sale.
Worked example: Two brands, same auction
| Company A | Company B | |
|---|---|---|
| 90-day LTV | $48 | $35 |
| CAC | $40 | $40 |
| Profit | $8 | −$5 |
So LTV sets your CAC, and your CAC sets how fast you can grow. That is why it matters.
Now the harder question: how do you actually measure it, and how do you act on it? You cannot wait a lifetime to find out what a customer is worth. You need the number now, because you are setting bids and budgets this week.
Two things matter here.
1. Time
Break LTV down by month
You can only wait so long before a customer has to pay back their dues and hand you the profit you reinvest. So measure what they are worth at 30 days, 90 days, and 365 days, not at some imaginary end point.
2. Product
Break LTV down by product
Not all customers are the same. The product someone buys first tells you how much they will go on to spend, so you need to know which products bring in the customers worth the most.
1. LTV by time
Pick fixed check-in points and measure everyone the same way: 30 days, 90 days, and 365 days from a customer's first order. Your 90-day LTV is the average amount a customer spends in their first 90 days. Because every group of customers is measured on the same clock, a June customer is directly comparable to a January customer.
90-day LTV
90-day LTV = revenue from the group in their first 90 days ÷ customers in the group
This turns LTV into a payback clock. Once you know what a customer is worth at day 30 and at day 90, you know how long your ad spend takes to come back, and whether you can afford to wait that long.
Worked example: The payback clock
- You acquire a customer atCAC = $100
- That customer is worth$70 by day 30 · $105 by day 90 · $160 by day 365
- LTV passes CACbetween day 30 and day 90
Run this for every quarter of new customers and you get the table below. This is the exact view we build in client audits, and it is usually the first time a brand sees how long their money is actually out the door.
LTV by month, per quarter of new customers
| Acquired | Customers | LTV 30d | LTV 90d | LTV 365d |
|---|---|---|---|---|
| 2024 Q3 | 3,780 | $69 | $99 | $155 |
| 2024 Q4 | 4,120 | $66 | $96 | $149 |
| 2025 Q1 | 4,390 | $70 | $103 | $160 |
Now put your CAC next to it. At a $100 CAC, the 30-day column says you are still down $32 a month in. The 90-day column says you are barely even. The 365-day column says you eventually make $55. Those are three completely different businesses, and one blended lifetime number hides all three.
2. LTV by product
Once you sell across multiple categories, every entry product brings in a different kind of buyer, with its own LTV, repeat rate, AOV, and order frequency.
Here is real category data from an apparel account. These customers were acquired off the same ad campaigns, bought on the same site, and received the same emails. The only variable was what they bought first:
LTV by first-purchase category
- T-shirts$99.55
- Jeans$83.82
- Accessories$80.65
That is a 23% gap between the best and worst category!
How to use this data?
This breakdown shows which entry products bring in your best customers. That changes how you run Meta ads, and it applies directly to email and SMS.
Tactic: adjust your welcome flow to feature your best-selling products, based on LTV.
Before
New Season, New You
Our story
After
New Season, New You
Shop bestsellers
The hero image stays untouched. Everything beneath it swaps a founder story nobody reads for the products your LTV data ranks highest.
The campaign version: turn generic catalog blasts into targeted sends built around your top LTV categories.
Before
We Sell Everything You Need
After
Seasonal Bestsellers, Curated For You
Section 2
Sales velocity
This one is simple. Marketing at its core is quite simple, even if consultants work hard to make it sound otherwise. All sales velocity means is how fast your products are selling.
Why does that matter? Because it is how you execute the least romantic definition of marketing ever written, from Sergio Zyman, Coca-Cola's first CMO:
“Sell more stuff to more people more often, for more money, more efficiently.”
When you know which products sell fastest, you know what appeals to the largest group of people. Feature those and you sell more products, to more people, with less friction. Recommending the right item raises your conversion rate, which is the “more efficiently” part of the sentence.
Pushing your top volume product in acquisition can still burn cash. High sales velocity often hides a high return rate and weak long-term spending, so read volume next to return rate and 90-day LTV. A slower mover can deliver the profit while your top seller moves inventory back and forth through the mail. Here is what that looks like across five products:
Sales velocity, read next to returns and LTV
| Product | Units / week | Return rate | 90-day LTV |
|---|---|---|---|
| Classic Tee | 820 | 14% | $71 |
| Slim Jeans | 540 | 22% | $68 |
| Merino Crew | 310 | 4% | $99 |
| Canvas Jacket | 190 | 11% | $84 |
| Logo Cap | 160 | 6% | $52 |
The Classic Tee leads on raw volume at 820 units a week, but a 14% return rate holds its 90-day LTV to $71. Slim Jeans looks strong at 540 units weekly, and then returns 22% and produces the lowest LTV on the list at $68. Merino Crew ranks third in volume at 310 units, returns 4%, and produces $99. Feature the Merino Crew in your acquisition ads and your core email flows instead of your top volume mover. Speed on its own would have pointed you at the wrong product.
We saw this exact dynamic with a roughly $30M DTC sock brand. Solid colours acquired new buyers, patterns kept them coming back. On first orders, patterns made up 27% of units. By order 10, patterns were 68%. Their standing rule became one sentence: lead acquisition with basics, push patterns from order 3 onward. That sentence now governs both the ad account and the email calendar.
Tactical recommendations
Once you have your products ranked by speed, return rate, and 90-day LTV, that ranking decides what goes in your flows and on your campaign calendar.
- Welcome flow. Feature the products that win across all three columns instead of whichever item sold the most units. Volume means nothing if a fifth of it comes back.
- Campaigns to new customers. When the send is aimed at people who have not bought yet, lead with the low-return, high-LTV products. The Merino Crew ranked third on units, but 4% returns and a $99 90-day LTV make it a better acquisition hook than the Classic Tee.
- Campaigns to returning customers. Reactivation sends should feature the products that keep people buying, not the ones that brought them in. Solids brought new customers through the door at the sock brand, and patterns were 68% of units by order ten, which makes patterns the right lead from order three onward.
Before
Our Most Popular Tee
Picked by unit volume
820/wk · 14% returns · $71 LTV
After
The Sweater You Keep
Picked by net LTV
310/wk · 4% returns · $99 LTV
Swapping the 820-unit Classic Tee for the Merino Crew cuts returns from 14% to 4% and raises 90-day LTV from $71 to $99. Using low-return, high-LTV products in acquisition slots builds a more profitable customer base than chasing raw volume.
Which products you feature is a margin decision you can make off your own order data. Picking them by sales rank, or by whoever spoke loudest in the planning meeting, costs you money on every send.
Section 3
Cart analysis
Which products get bought together?
You have seen this on Amazon a thousand times: “frequently bought together.” That feature runs on product journey analysis, and it is how you raise average order value. Rather than pushing customers toward whatever carries the fattest margin, you find what they already buy together and recommend the item that completes the cart.
The measure is co-purchase rate: how often two products land in the same cart. You do not need a new tool to get it, because your order history already holds it. Here is what it looks like for one product:
Products bought in the same cart
Customers who bought the Classic Tee
- Slim Jeans34%
- Logo Cap21%
- Crew Socks18%
- Canvas Jacket9%
- Leather Belt6%
The ‘Incomplete’ Purchase
For many brands, the highest probability of a repeat purchase falls within 14 days of the first order. Most founders assume a fresh buyer needs space and will not order again so soon. The data says the opposite. A customer who just gave you money is in the strongest buying window they will ever enter.
Despite that, most brands suppress new buyers from promotional sends and route them into a light post-purchase flow of shipping updates and a product guide. Holding back feels polite, which is why almost every ecommerce team defaults to it. The consequence is that the two-week window with your highest buying intent gets the least selling.
Treat that first order as an incomplete purchase on your end. I do not know why a meaningful share of buyers place a second order within two weeks. Maybe getting the first package lowers the risk of trying something else, or maybe buying once reopens the decision to shop, but those are guesses. The exact reason does not change what you should do. The window is real, so look at your co-purchase data to see what pairs with that first order, then put those products in front of them before it closes.
Tactical recommendations
Co-purchase data replaces the generic bestseller block in three flows you are already running:
- Post-purchase cross-sell. Fire the measured pairing right after checkout, while intent is still high, in the upsell and in the first post-purchase email.
- Abandoned checkout. Someone who abandoned at checkout already picked a product, so the recovery email can carry that product's measured pairing instead of a bestseller grid.
- Browse abandonment. Send back the product they looked at plus what it is usually bought with, so they see the full outfit rather than one item.
Before
Thanks for your order
After
Thanks for your order
Goes with your Classic Tee
Keep the standard confirmation receipt intact and append measured co-purchases directly below it. Since the package has not shipped, buyers can add items to their existing order instead of placing a second one.
Split the offer by fulfillment
Match your post-purchase messaging to whether your warehouse has printed the shipping label:
- Checkout until shipping label, 24 to 48 hours. This shortest window carries no second pick, pack, or shipping fee, giving you the margin headroom to run your most aggressive add-on offer.
- After shipping, through day 14. Every purchase now needs a fresh label and pick, so switch to offers suited for new orders: free-shipping thresholds, bundle pricing, or straight discounts.
- At the fulfillment cutoff. Remove all “add to your order” copy the minute the parcel ships, or support will spend the week answering tickets about split shipments you could never honor.
First-order basket size predicts long-term value about as well as which product they bought first. On the $30M sock brand, the biggest first-order basket segment bought roughly 11 times the lifetime units of small-basket buyers. That number is sitting in your order export right now.
Section 4
Product journey analysis
What is each customer most likely to buy next, based on what they already bought?
The “more often” piece of Zyman's formula is where retention revenue lives. Next-product analysis answers the question behind it: based on what a customer already bought, what are they most likely to buy next? That answer turns your next order from a hope into a concrete recommendation you drop straight into a flow.
Personalization spans a wide range of decisions, including send timing, channel, offer depth, and imagery. Dropping a first-name tag into a subject line is basic merge data. Matching your product recommendations to what someone already bought drives more repeat revenue than any other form of it, and it is the piece most brands leave out.
Careful: bought-together and bought-next are different data answering different questions. Bought-together is same-cart pairing (section 3), which is what bundles and checkout add-ons run on. Bought-next is the sequential path across separate orders, weeks apart, and that is what your flows need. Mix them up and you will put cart add-ons in your winback emails and wonder why nobody clicks.
This diagram maps order sequences from order one to order three. The width of each path shows the share of customers who took that route:
What customers buy on their 1st, 2nd, 3rd and 4th orders
T-shirt buyers move into Jeans on their second purchase. Jeans buyers spread toward Outerwear, and by the third order the rest of the catalog opens up. Each step is a measured majority path you can put in an email instead of guessing with top sellers.
Real numbers from one multi-category account: buyers who entered through the gateway category went on to buy from other categories at 73%. Every other entry point cross-shopped at 54 to 57%. That split assigns the roles: gateway products headline acquisition campaigns, destination products live in post-purchase flows, where the 73% are already headed.
Tactical recommendations
Once you map the order paths, the sequence drops straight into three placements:
- Post-purchase cross-sell. Send the measured next product, timed to the day window when previous buyers took that step, instead of a generic bestseller.
- Winback flow. A lapsed customer gets the product the journey says comes next for people like them, not the storewide bestseller list.
- Campaigns to returning customers. A launch or reactivation campaign in one category goes hardest at the segment whose journey points straight into that category.
Before
We miss you
After
Picked for your next order
The original email begs for a return using generic bestsellers. The revised email presents the item this customer is statistically primed to buy next.
Section 5
Purchase latency, churn prediction, and the winback system
When is the best time to cross-sell? And when do you go all out to win a customer back?
Section 4 showed you what a customer wants to buy next. This section covers when they want it. Purchase latency is the number of days a customer waits between orders, and it sets the clock for every automated flow in your account. You sell to people more often only when your message lands on their natural buying schedule, not a timeline set on a whiteboard.
Here is what that looks like. Every repeat buyer, sorted by how many days they waited before ordering again:
Days between order 1 and order 2
Share of repeat buyers, by how long they waited
The bulk of the reordering happens between day 20 and day 90, with a long tail that runs past six months. The median sits at day 76, which means half of everyone who comes back has already come back before that point. A flow set to the median reaches them after they decided, and a winback set to day 90 reaches them after most of the distribution has passed.
And here is the rule almost everyone gets backwards: you fire earlier than the median. The median is the middle. Half your buyers are ready before it. A flow timed at the median shows up after half the reorders already happened, with or without you.
Worked example: Timing the cross-sell flow
- Median gap, order 1 → order 276 days
- Half your buyers reorderbefore day 76
- So the flow fires at~ day 55, not day 76
The gaps also differ per order pair. Real medians from client data: about 76 days from order 1 to 2, tightening to about 29 days past order 15. Loyal customers run on a faster clock. Time each flow to its own gap, per order number, not to one blended store average.
Churn prediction is the same math read in reverse: given this customer's own rhythm, how quiet is too quiet? A weekly buyer who goes silent for 30 days is gone. A 90-day-rhythm buyer who goes silent for 60 days is right on schedule. One suppression rule for both is how brands throw away customers who were never lost.
Tactical recommendations
Once you calculate your latency numbers, they set the timing in three places:
- Cross-sell flow. Set the delay before the median gap. If your median time between order one and order two is 76 days, the flow fires around day 55, and you calculate that gap separately for each order step, since third and fourth orders run on a faster clock.
- Winback flow. Trigger it off the buyer's own rhythm. A weekly buyer silent for 30 days is already lost, while a quarterly buyer at day 30 is right on schedule.
- Both of them, paired with section 4. Section 4 identified the item a customer is most likely to buy next, and the latency data names the day they will want it. Together they replace two guesses with two numbers from your own order history.
The day counts inside those delay boxes are the highest-leverage settings in your account, and most brands leave them on whatever default came with the template. Filling them from your own latency data is the difference between arriving while the customer is deciding and arriving three weeks after they bought from a competitor:
The flow, timed off your own numbers
The recommendation never changes. The offer climbs with the gap.
Placed Order
Any customer, 1st order
Cross-sell
The measured next product, from section 4
No offerPicked for your next order
Winback 1
Past the median gap, motivation starts slipping
Free shippingYour picks, shipping on us
Winback 2
Into the tail of the distribution
15% offStill yours, now 15% off
Winback 3
Deep tail. Direct mail earns its cost here too.
25% offLast call, 25% off
The single-flow winback mistake
The biggest winback mistake is relying on a single flow email around day 90, with no campaign system behind it. That bets your entire lapsed-customer revenue on one automated touchpoint written months ago. Winning back a customer takes repeated attempts over time, and my own agency's sales work the same way.
My personal experience
If you have ever worked in sales, you might relate to this. I just closed a client two years after first contact. Over 24 follow-ups in between. Now imagine I had treated that relationship the way most brands treat their winback flow.
Your brand
Day 90 · delivered while she was on vacation
Day 97 · suppressed, no further sends
Day 137 · she was ready. You were gone.
The fix: layer monthly winback campaigns to lapsed segments on top of the flow. Flows go stale fast, and a winback email written 12 months ago is often pitching last year's catalog. Campaigns carry current product launches, seasonal offers, and recent restocks, and new is always good in marketing: lapsed customers already ignored your old pitch, so news gives them a fresh reason to look. These sends are routinely the highest-revenue campaign of the month, because the audience is massive and nobody else is mailing it.
Do not sunset customers
I have run this analysis over and over, on account after account. Even in segments that have not opened an email in 6 or more months, every send to that group brings some customers back. And the return beats the cost savings on your email platform bill. It is not close.
Prospects are a different story. Someone who grabbed a discount code and never bought is fair game for pruning. But a customer, a person who paid you money and has not refunded you, does not get suppressed because a flow timer ran out. Suppressed customers are where past revenue goes to sleep. Wake it up.
The winback system
Put together, winback runs as a system with four parts, not one flow:
- Re-triggers inside the flow: additional sends at delays of weeks, then months. The day-90 email is the first attempt, never the last.
- Monthly winback campaigns to lapsed segments, carrying whatever is new this month.
- Direct mail for high-LTV lapsed customers email can no longer reach. A postcard has no spam folder.
- A secondary popup for returning lapsed visitors, letting them climb the discount ladder instead of staring at the same new-subscriber offer they already ignored.
Receipts: at a haircare brand we staged a reactivation of long-suppressed buyers, recent-first, on a deliverability-safe ramp, watching the platform bill the whole way. A within-subject measurement on the same book of work showed +47 to +121% active-customer lift when a real reactivation offer hit the lapsed base.
The customers were never gone. The brand had stopped talking to them.
The offer ladder
Time dictates what a buyer needs to hear. The longer someone sits silent, the more effort it takes to pull them back into an order. A blanket 20% discount to every lapsed customer misprices your margin at both ends: it hands profit to a day-60 buyer who was coming back anyway, and it fails to move a day-200 buyer who forgot your brand. The diagram below shows how that changes as the days pass.
BJ Fogg ran the Behavior Design Lab at Stanford and compressed human action into one equation: Behavior equals Motivation, Ability and a Prompt, written B = MAP. The model says a behavior happens only when all three arrive at the same moment. Miss one and nothing happens.
- Motivation. How badly the customer wants to buy from you at this exact second. For lapsed buyers it decays steadily as the days since their last order pile up.
- Ability. How easy the purchase is to actually complete right now. You raise it by cutting steps out of the transaction, with saved carts, prefilled sizes and one-click reordering, not by writing better copy.
- Prompt. The signal telling them to act now. Your email and SMS sends are prompts, and they are the only one of the three that most brands ever work on.
A worked example. A runner bought shoes from you 200 days ago. Her motivation to reorder today is flat, so an email showing new colourways reaches her inbox and gets deleted without a thought, because the prompt landed below the action line. Move both axes and it changes. An offer of 30% off supplies the missing motivation, and a link that pre-loads her size 8.5 into a saved checkout supplies the ability. The same prompt now lands above the line, and she buys.
Which is why the days elapsed since the last purchase are really the motivation axis moving downward. Early in the distribution, motivation is high enough that the prompt alone converts. Out in the tail it has decayed, and that exact same email lands flat.
The product recommendation from section 4 stays in every message at every stage, because knowing what someone wants to buy next never stops being useful. What changes as the days accumulate is how much offer you stack on top of that recommendation. Inside the natural 20 to 90 day window, send the recommendation with no discount at all. At the median gap around day 76, add a small nudge like free shipping or bonus points. Deep in the tail past day 180, layer on a real price cut, or test direct mail. You only pay for reactivation where the momentum has actually died.
Section 6
Offers and the subscription fork
Offers are the reactivation lever. And every offer has a demand ceiling: the share of customers who ever naturally buy at that basket size. Before you launch an offer, check whether the demand exists at that rung.
Worked example: The demand ceiling
- Customers who ever hit 5 units in an order57%
- Customers who ever hit 8 units6.4%
- Customers who ever hit 10 units3.5%
Your demand ceiling
Share of customers who have ever bought this many units in one order
Layer, do not replace. Modeled on real order data: layering a new offer tier on top of the existing ladder added $1.4 to 2M a year, while every replacement scenario carried downside. The mechanism is boring and ruthless: customers downgrade to the cheapest path you leave open. Remove a rung and they do not climb. They step down.
A deeper offer can beat a shallower one, which surprises everyone the first time. Buy-2-get-3-free beat BOGO on AOV (+9.7%), units (+20%), and per-customer revenue (+14%) despite the deeper discount. The mechanism is basket commitment: a customer who commits to a bigger basket spends more even after the giveaway. Test commitment depth, not just discount percentage.
And watch the habit gap. On the same account, 44% of customers took the big offer once. 6.6% took it twice. All that offer bought was a trial, and a trial nobody follows up on expires. The LTV lives in the second purchase, so an offer program without a dedicated second-purchase flow is paying full price for customers it then hands back.
Case study
We reduced a client's LTV and made them more money.
−25%
LTV
−50%
CAC
One of our clients swapped their acquisition offer for a deep discount. Lifetime value dropped 25% almost immediately. On paper, most operators would call that a failure and kill the campaign.
Then acquisition cost dropped 50%. The savings on acquisition outweighed the lost lifetime value, so the brand made more per customer than before and scaled budget into the new offer.
LTV and CAC do not move hand in hand. That disconnect gives you the freedom to make moves that look illogical on paper and pay off anyway. Stack two or three of these lopsided levers and you reach a level of scale that a sensible growth plan never gets near.
So never write off an offer on LTV alone. Pull the acquisition cost before you judge it.
If you run subscriptions
The levers, biggest first: day-zero churn (cancels before the second shipment), one-time-buyer-to-subscriber conversion, the cancellation page (the highest-intent save moment you own; nobody on that page is indifferent), billing reminders, order-3 retention. And one rule above all of it: your subscription offer must beat your own promo ladder. We killed a subscription tier because the site's BOGO was mathematically better than subscribing. Customers ran that math too. At checkout. In seconds.
If you don't
The same economics arrive through different doors: replenishment-timed flows (section 5) do the job of the recurring shipment, the offer ladder does the job of the subscriber discount, and a paid membership does the job of the commitment. Real membership receipt: 1.8% cart take-rate with zero conversion drop. Small number, pure margin, attached to your best customers.
Either way, run the latent-subscriber method: find customers already behaving like subscribers (3 or more purchase occasions on a steady cadence) and convert the behavior into a commitment. They have proven the habit; they just lack the label. And haircut every subscription projection by 40 to 60% cannibalization, because a big share of subscription revenue would have arrived anyway as one-time orders. Skip the haircut and your forecast is fan fiction.
The subscription fork
The same jobs, done two different ways
| The job | If you run subscriptions | If you don't |
|---|---|---|
| The recurring shipment | Subscription cadence | Replenishment-timed flows (section 5) |
| The standing discount | Subscriber pricing | The offer ladder |
| The commitment | Locked-in plan | A paid membership |
| The early drop-off | Day-zero churn, before shipment 2 | Second-purchase flow |
| The save moment | Cancellation page | Winback at the median gap |
| The reminder | Billing reminders | Low-stock and reorder nudges |
Section 7
SMS: why the metrics are different
This section is being written and lands in this guide shortly: why earnings per message per segment (list-level revenue per recipient) is the right SMS KPI even though the same metric is the wrong one for email.
Section 8 · Bonus
Bonus: Stacked segmentation and RFM
This section is being written and lands in this guide shortly: stacking recency, frequency, and product-category layers into segments that map to the LTV math above.
Free Klaviyo audit
This is the analysis we run on real accounts.
We pull your LTV by products, your next-product paths, and your winback gaps, and show you where the revenue leaks. No deck of best practices. Your numbers, on a call.
Get the free audit